top of page
SARAH HORN
Graphic Designer | Detail-Driven Creative | Problem Solver

HOW RODGERS AND HAMMERSTEIN REVOLUTIONIZED BROADWAY
DATA VISUALIZATION
Rodgers and Hammerstein Data Visualization: Services
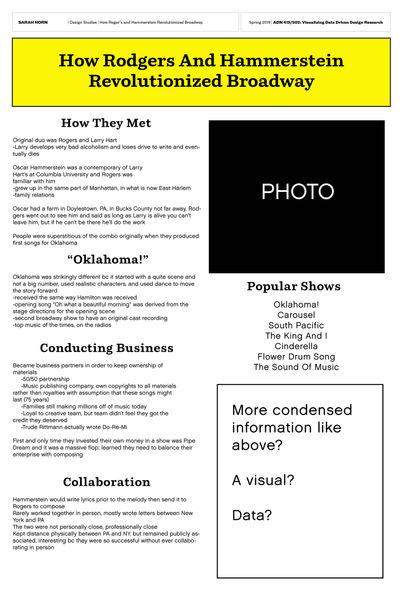
For my Visualizing Data-Driven Research class, we were assigned to find a podcast online that describes how something works or “stuff you should know”. My research theme for all projects this semester is focused around Broadway so I decided the use the podcast, “How Rodgers and Hammerstein Revolutionized Broadway” from the Hidden Brain on NPR as my starting point. After listening to the podcast and gathering all of the data I needed, I did some additional research to find more statistic-based information as well as photos for my poster. The following is my final data visualization infographic poster, the physical (with a few sticky-note comments from my peers after a final critique) and more visible digital portions.
Rodgers and Hammerstein Data Visualization: Work
Below is my project transformation, starting at my rough draft, then the additional versions I created the get to my final project. This shows how iterative design and feedback is crucial to my work and how it functions as a whole for my audience. Through these different versions I was able to distinguish legibility and readability difficulties as well as improve the syntax and organization of visual, symbolic, and textual elements.
Rodgers and Hammerstein Data Visualization: Bio
Rodgers and Hammerstein Data Visualization: Work
bottom of page


